Case study · Orita
The model has to show its work
Orita’s product is a machine-learning model’s judgment: which customers an e-commerce brand should stop emailing, and what revenue that protects. The output is statistical. Lift, holdouts, projections. The customers reading it are marketers, and this is how the interface learned to do the explaining.
- Role
- Sole designer; contractor, continuous since 2021 and ongoing
- Shipped
- Lift-summary redesign, Sept 2025Campaign Planner MVP, Mar 2026Automated customer insight pipeline, Apr 2026
- Timeline
- 2025–2026
- Site
- orita.ai
The cost of an unexplained number
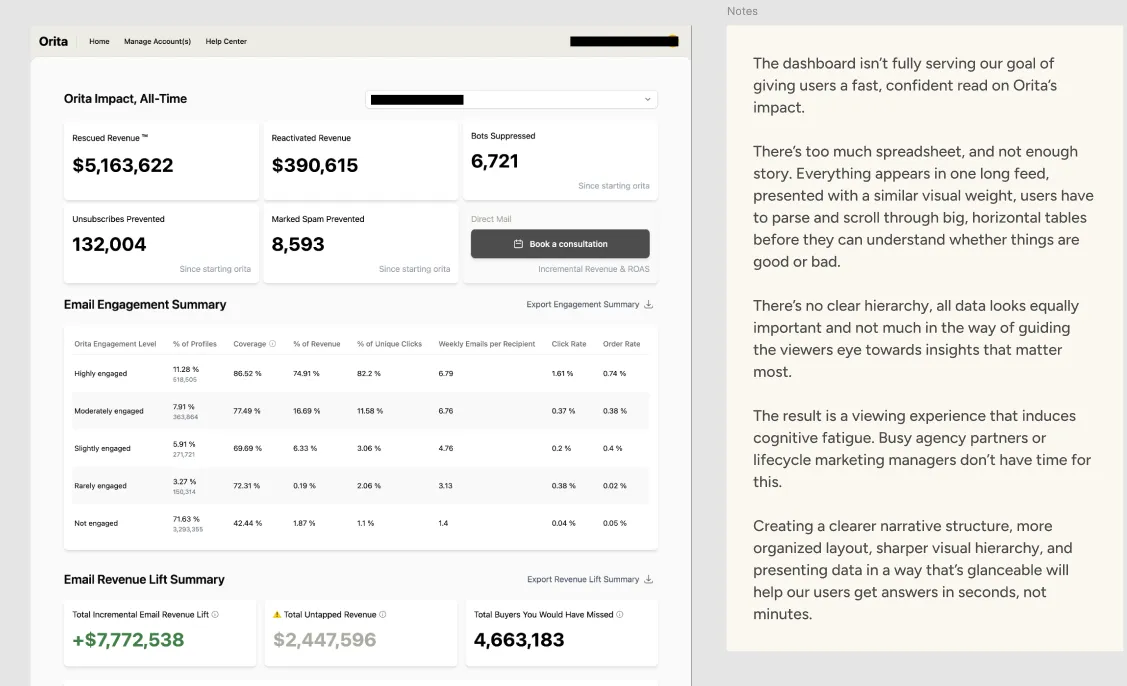
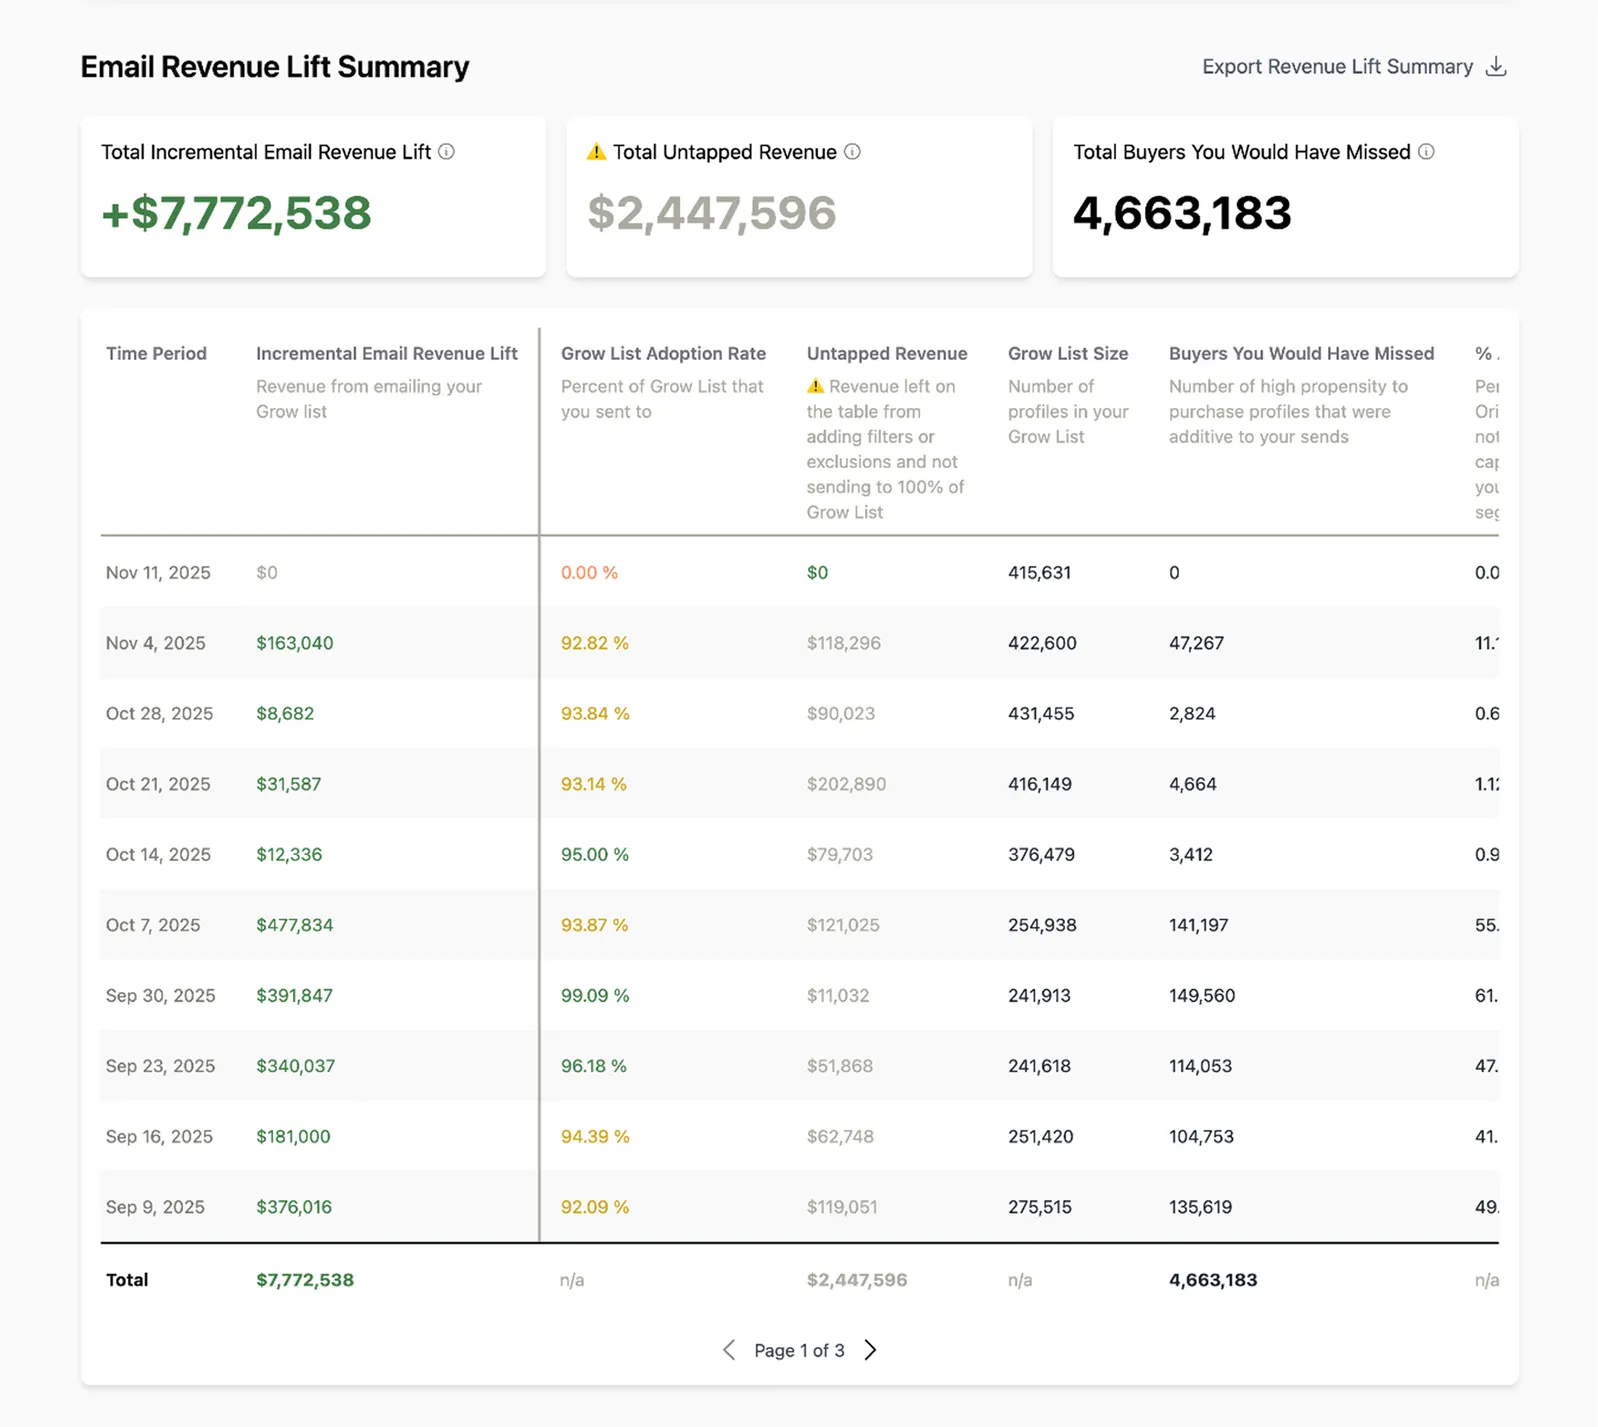
The gap between the model and its readers showed up everywhere I looked. An agency principal in my research interviews wouldn’t give her clients dashboard access at all; she screenshotted the parts she thought they’d follow into her own decks. Customers misread untapped revenue in the lift summary as revenue they earned; our customer success team watched it happen while presenting. In one month of 2026, four customers separately told us they couldn’t tell why a number in the dashboard was what it was.
When a model is right but can’t account for itself, it doesn’t get trusted — it gets misinterpreted, rebuilt by hand, or ignored.
Naming the problem before it had a ticket
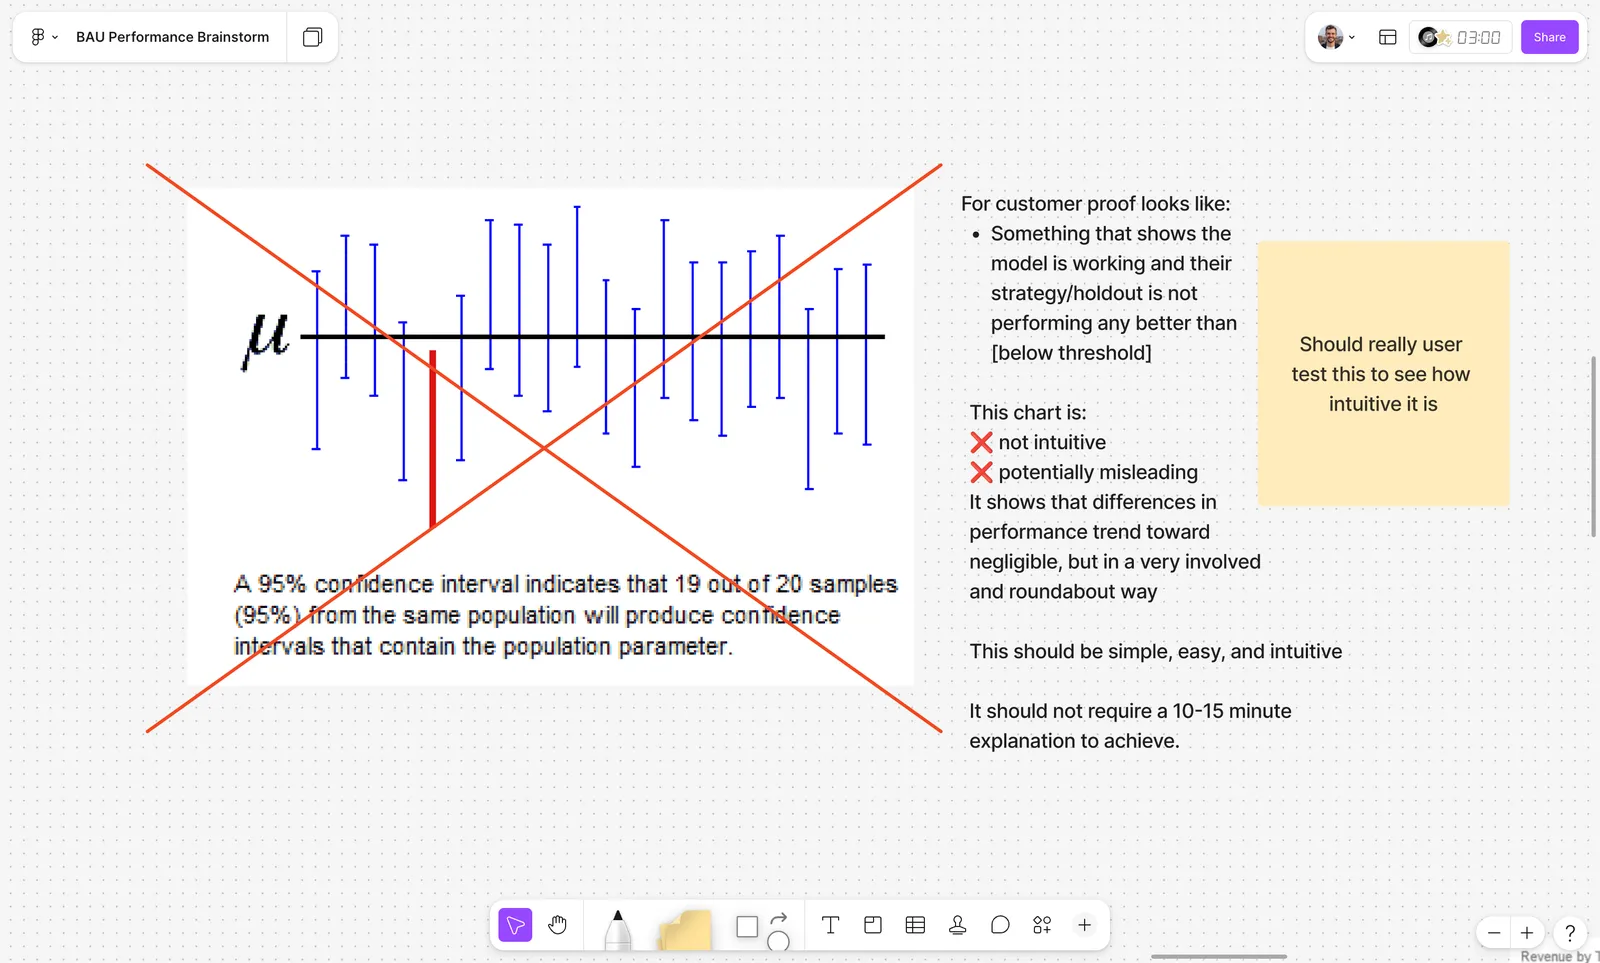
In March 2025 the CEO walked the team through the statistics behind Orita’s claim: a bootstrap test, a confidence interval, and the finding that the people we recommend suppressing perform no differently whether they’re emailed or not. It was the slide that proved the product works, and he asked whether anyone could think of a better way to show it. My note on the chart: “not intuitive, potentially misleading. It shows that differences in performance trend toward negligible, but in a very involved and roundabout way.” My standard, next to it: “it should not require a 10–15 minute explanation.”
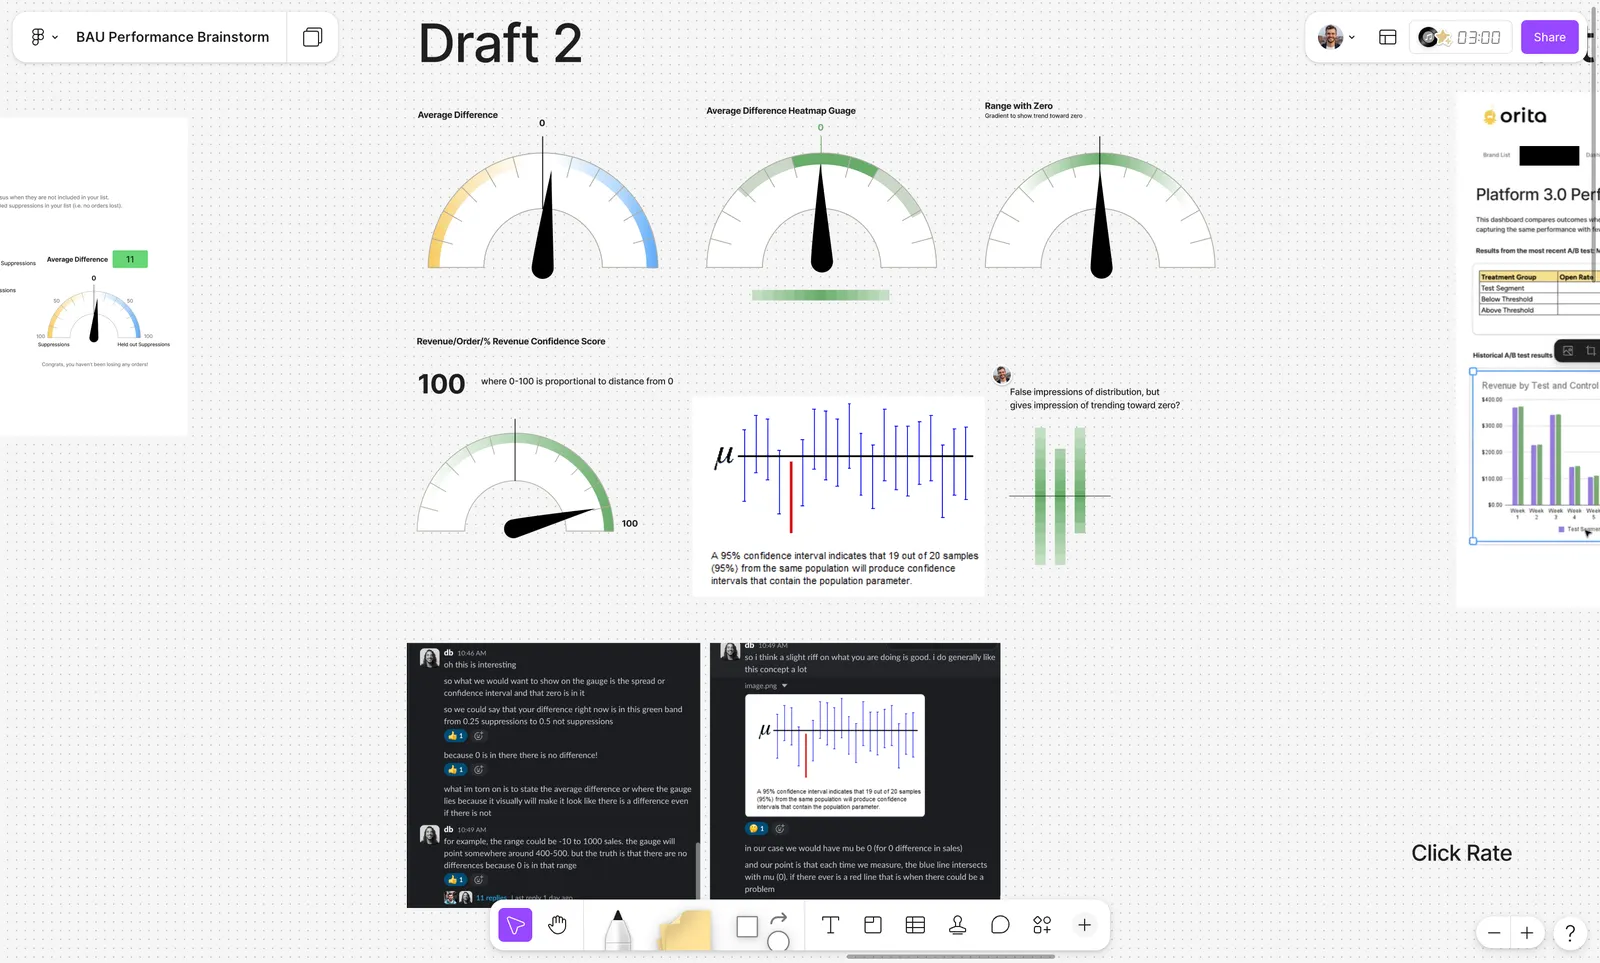
I spent four drafts on it. First a gauge centered on zero. Then the CEO’s objection, in Slack: a gauge that points at the average difference “will make it look like there is a difference even if there is not,” because the honest answer isn’t a number, it’s that zero sits inside the range. So: a gauge showing the band instead of the needle, a confidence score proportional to distance from zero, a range display fading toward zero, with my own doubt attached (“false impressions of distribution?”). Every intuitive display lied a little; every honest one needed the explanation back.
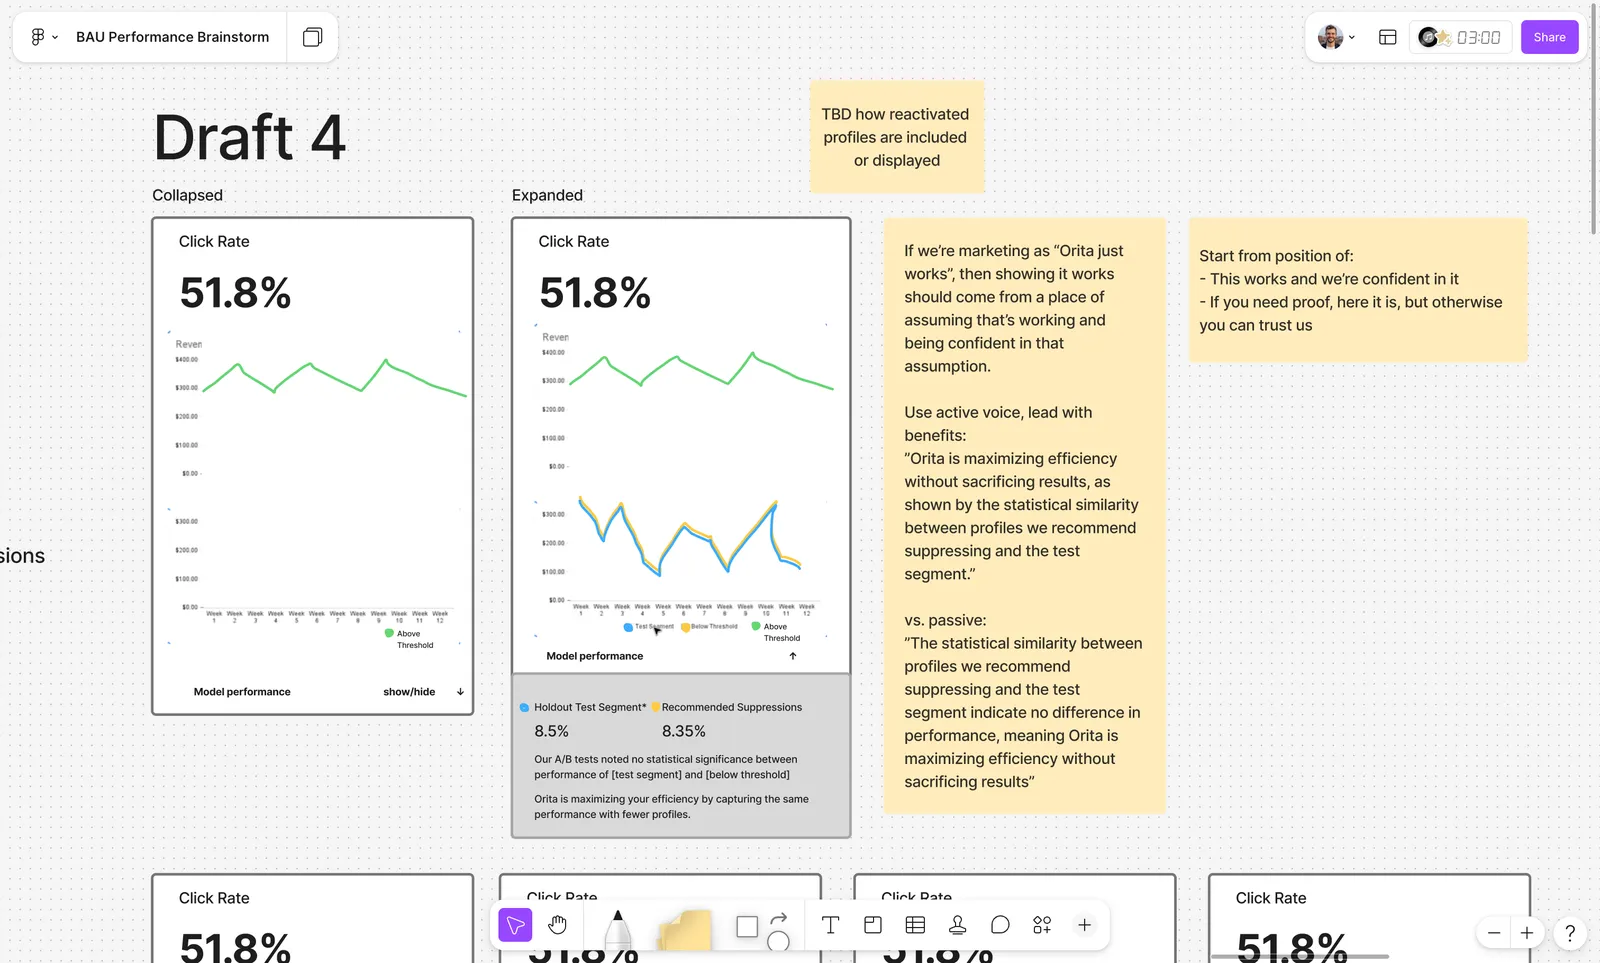
Draft 4 is where the argument landed. Stop restyling the statistic. The card leads with the number a marketer cares about, and the proof lives under a toggle, hidden by default: start from “this works and we’re confident in it; if you need proof, here it is, but otherwise you can trust us.” None of the gauges shipped. The posture stuck.
Shipping legibility
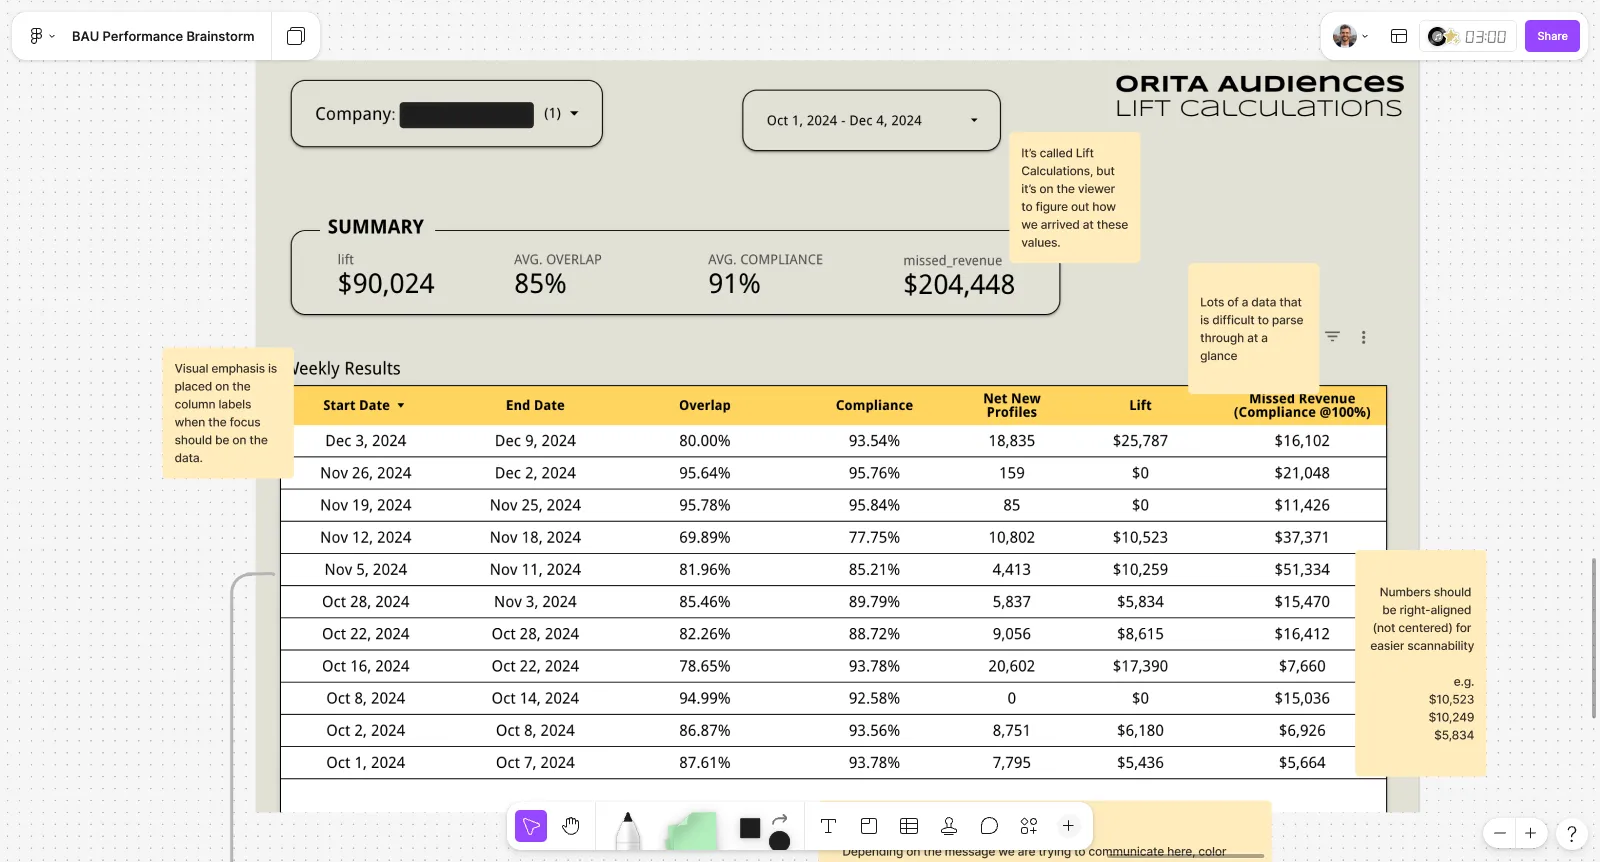
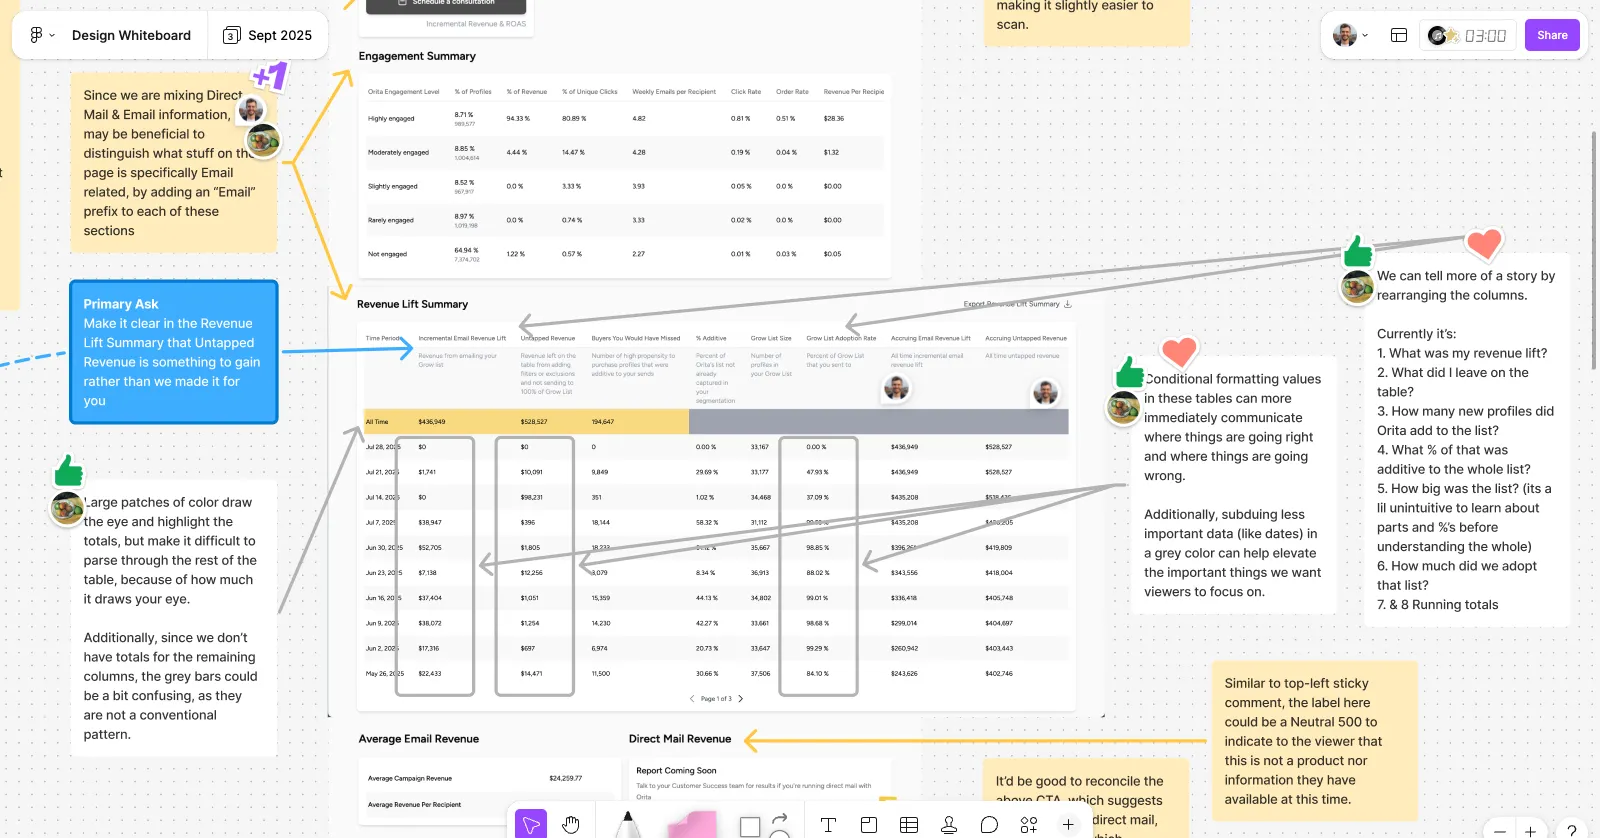
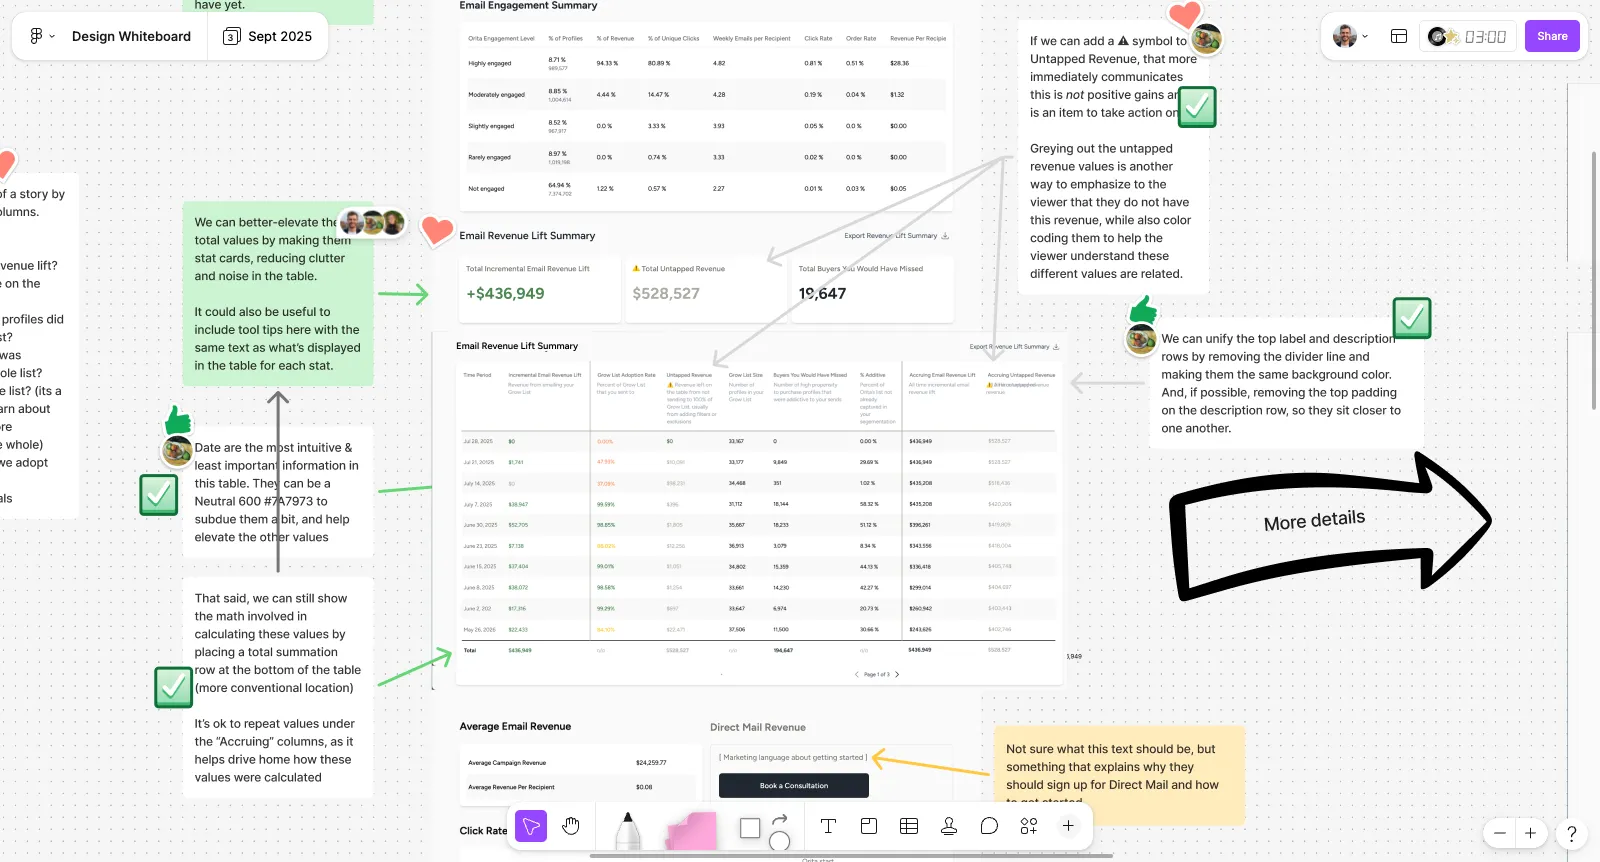
The same March board held a second critique, of the report customers actually saw: “It’s called Lift Calculations, but it’s on the viewer to figure out how we arrived at these.” Through fall 2025 that critique became working designs on a shared whiteboard: tooltip-the-math, stat cards, conditional formatting, columns reordered to tell a story, a red-connotation fix. Stakeholder approvals sit inline on the board itself. The revenue-lift summary redesign shipped that September — an engineer implemented it — fixing the specific way customers had been misreading untapped revenue.
In parallel I ran the research that grounded the work: a UX audit, a card sort, a competitive teardown of retention dashboards, and interviews — three colleagues on the customer-facing side, three agency-side users. Two of those stakeholders are the ones whose approvals sit on the board.
What I claim
In September 2026 an engineer checked the portal’s event logs: the summary has no event of its own, and the dashboard’s view event counts API calls, not page loads, so the data can’t say.
What I would have tracked: how often CS had to correct the reading mid-presentation, whether the untapped figure changed what a customer did next, and the count of “why is this number what it is” support conversations.
Documented rows have a dated artifact I can produce on request. Recollection is mine, undocumented.
Explaining the logic, not the code
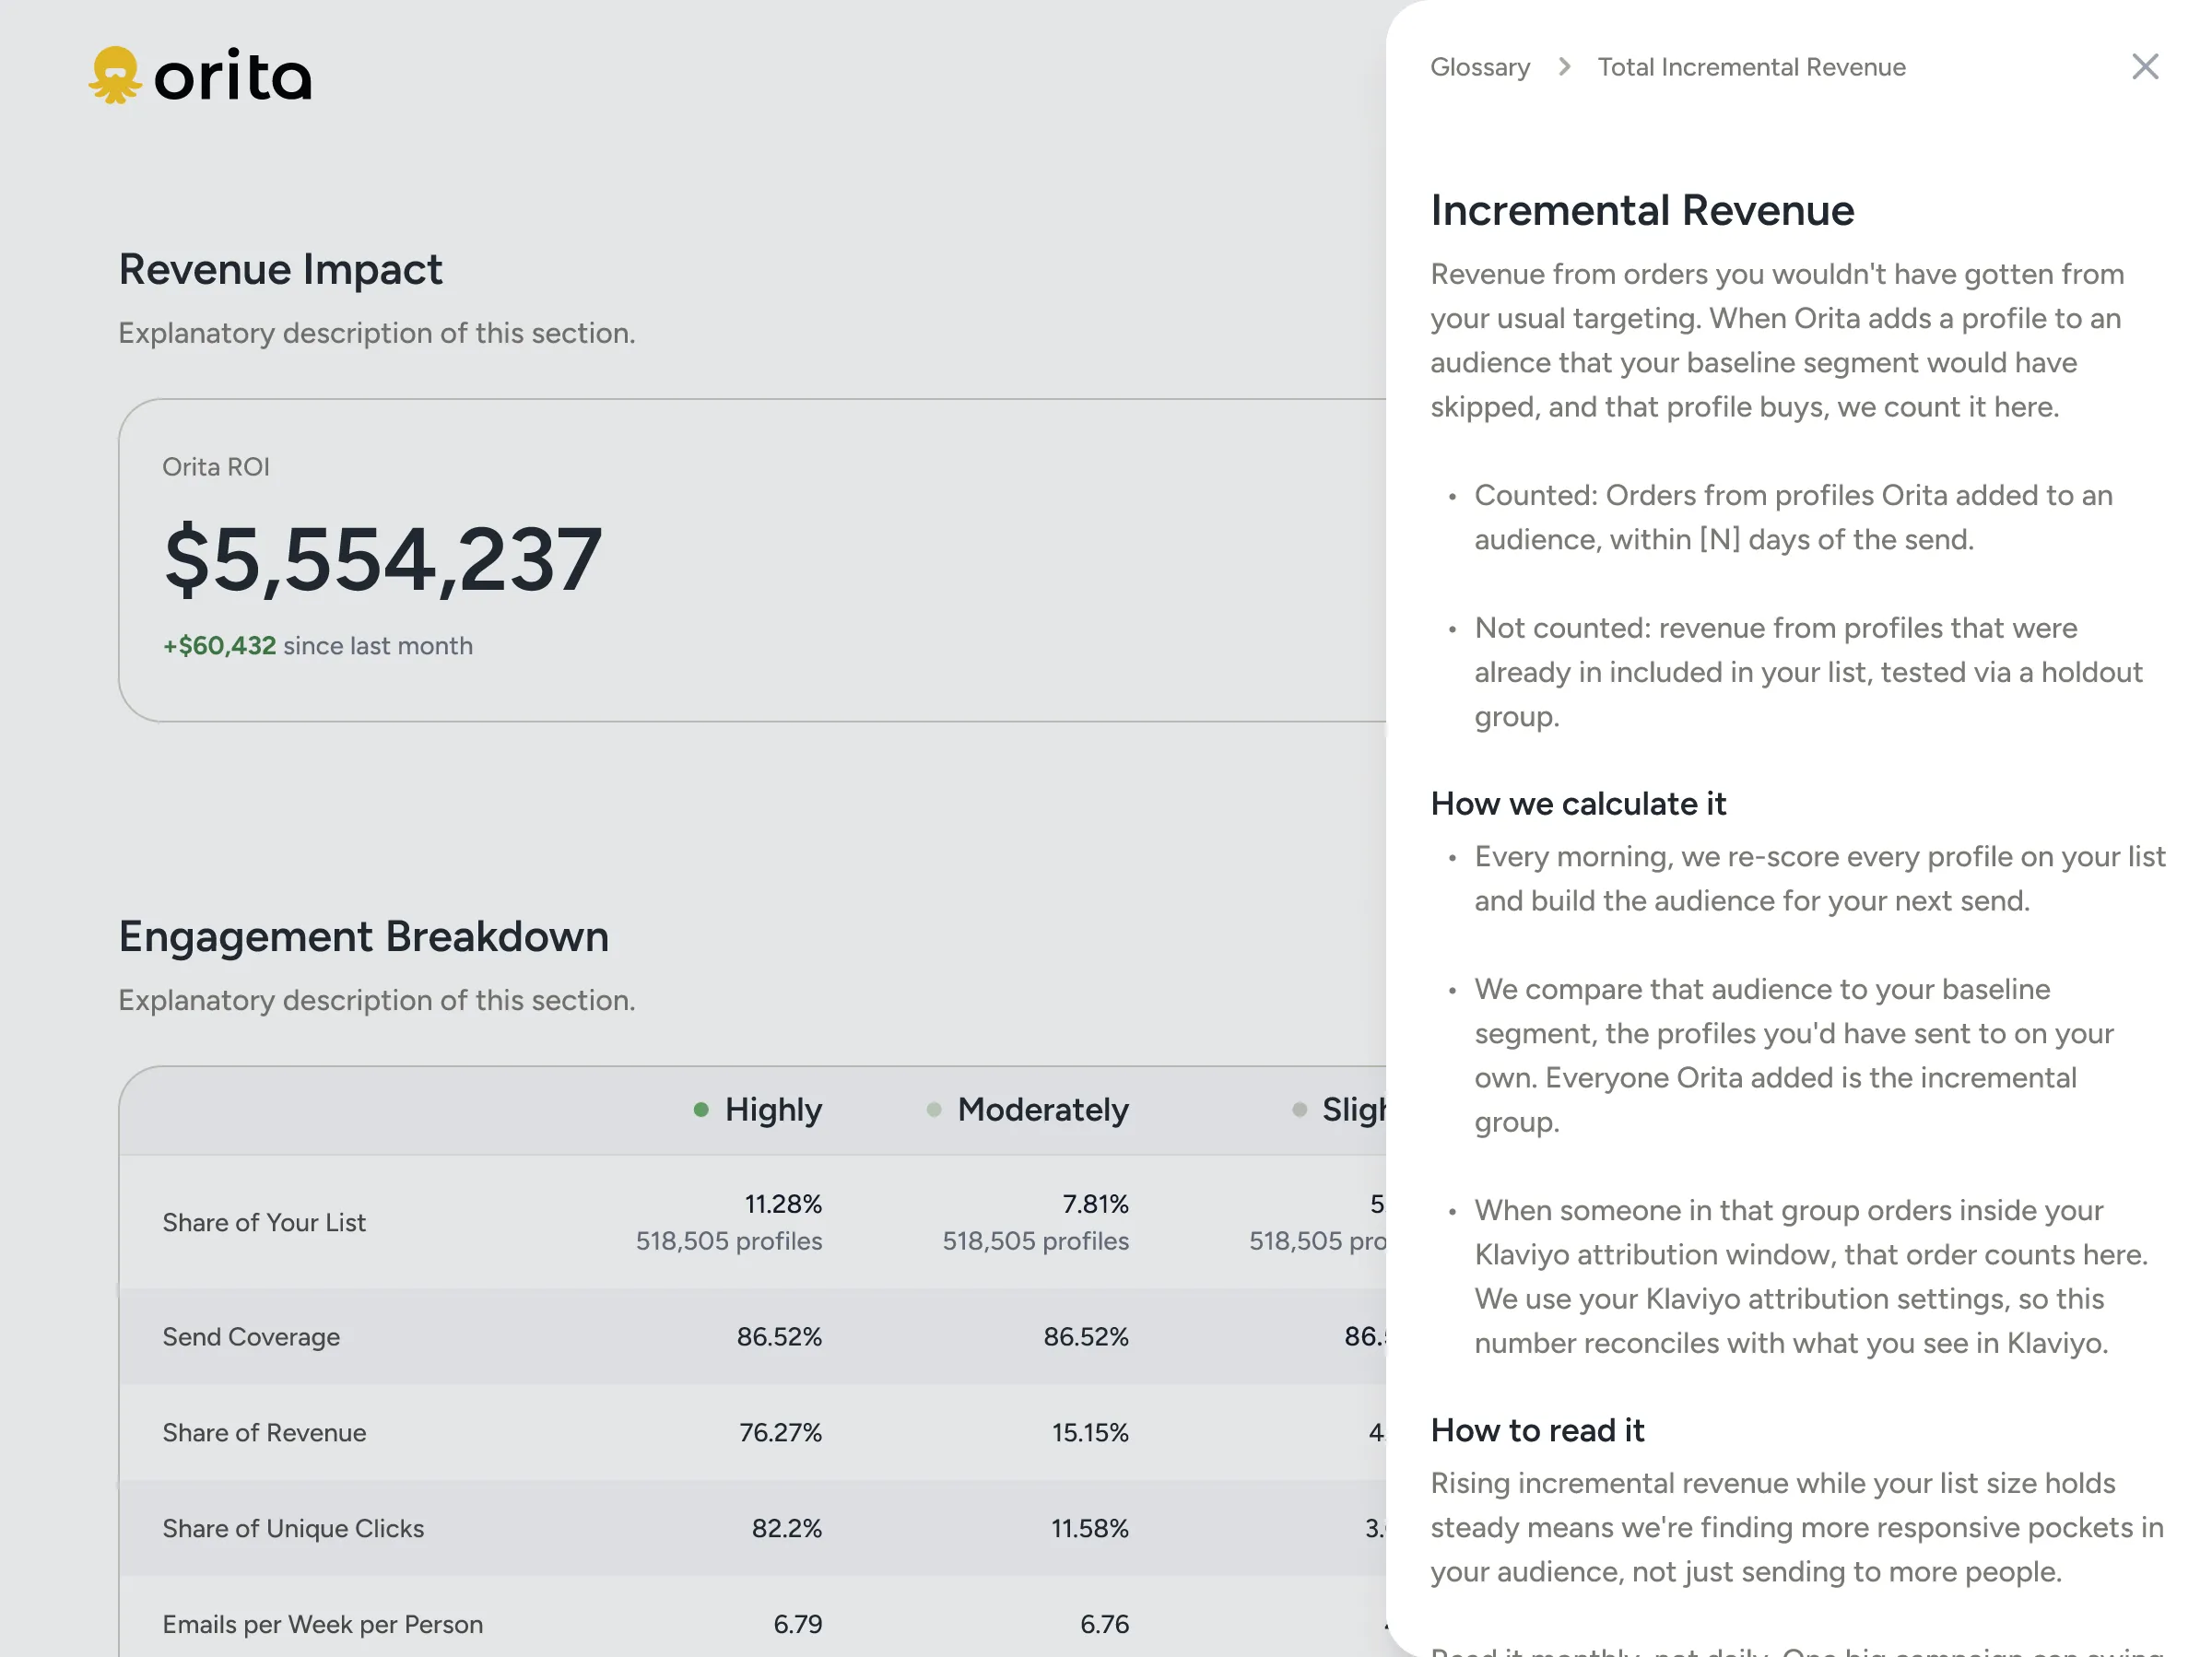
The dashboard had carried explanations before; the shipped lift summary put them under its column headers. My late-2025 dashboard mocks gave the explanation a layer of its own, with more room and more context: plain-language metric definitions, interpretive guidance lines, and a working principle written on the board: “one short paragraph or 3 bullets explain the logic, not the code.” The frame for the whole dashboard was three customer questions. Is Orita working? Why? Where is the impact coming from?
The Campaign Planner week
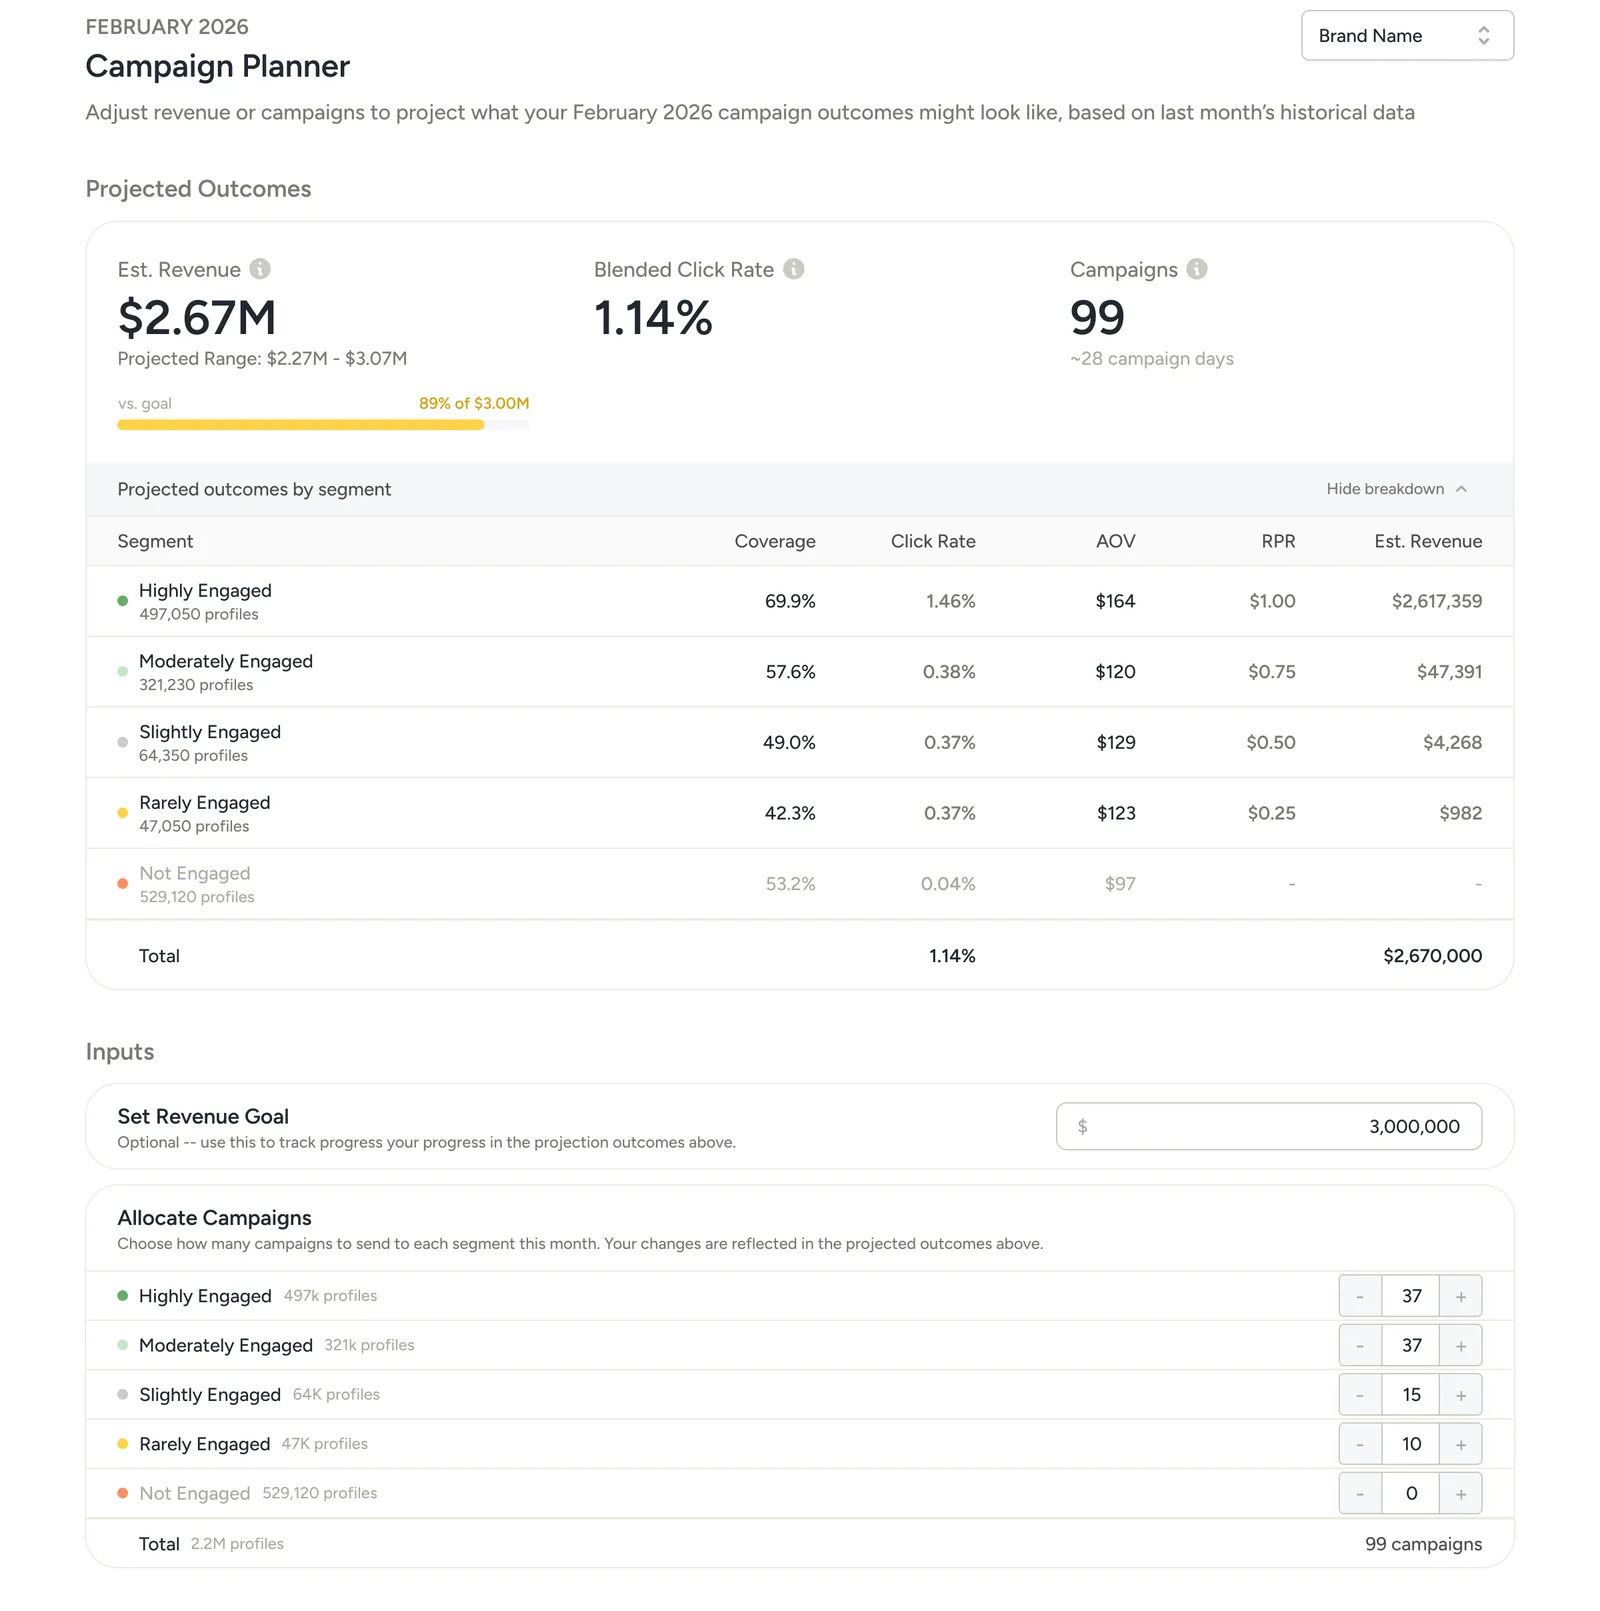
In February 2026 I was formally assigned design of the Campaign Planner, a scenario-planning tool built on the model’s projections. The planner was the head of product’s idea; a project lead ran customer discovery with five pilot brands; I reworked a teammate’s AI-generated mockup and synced near-daily with engineering through the build week. My pass took that mockup to the shipped MVP in about a week; the team’s retro recorded “first hearing about the project to a near-final design within a week.”
The calls that shipped: a range on the headline projection rather than a single number, because one number reads as a promise the model can’t keep. Numeric inputs and steppers over the mockup’s sliders: precise refinement, and a smaller footprint in an already crowded layout. Progressive disclosure, so the first read is simple and the proof is one layer down. Clear affordances separating what the user can edit from what the model reports. Conditional formatting that shows whether each change helped.
The planner did get counted. It fires a real view event, and by mid-June, three months after launch, about three in five of the customers active in a given week were opening it; roughly a third of everyone active in that window had opened it at least once. Use grew steadily rather than spiking. That is the planner’s reach, not a measure of my decisions inside it.


Keeping the loop running
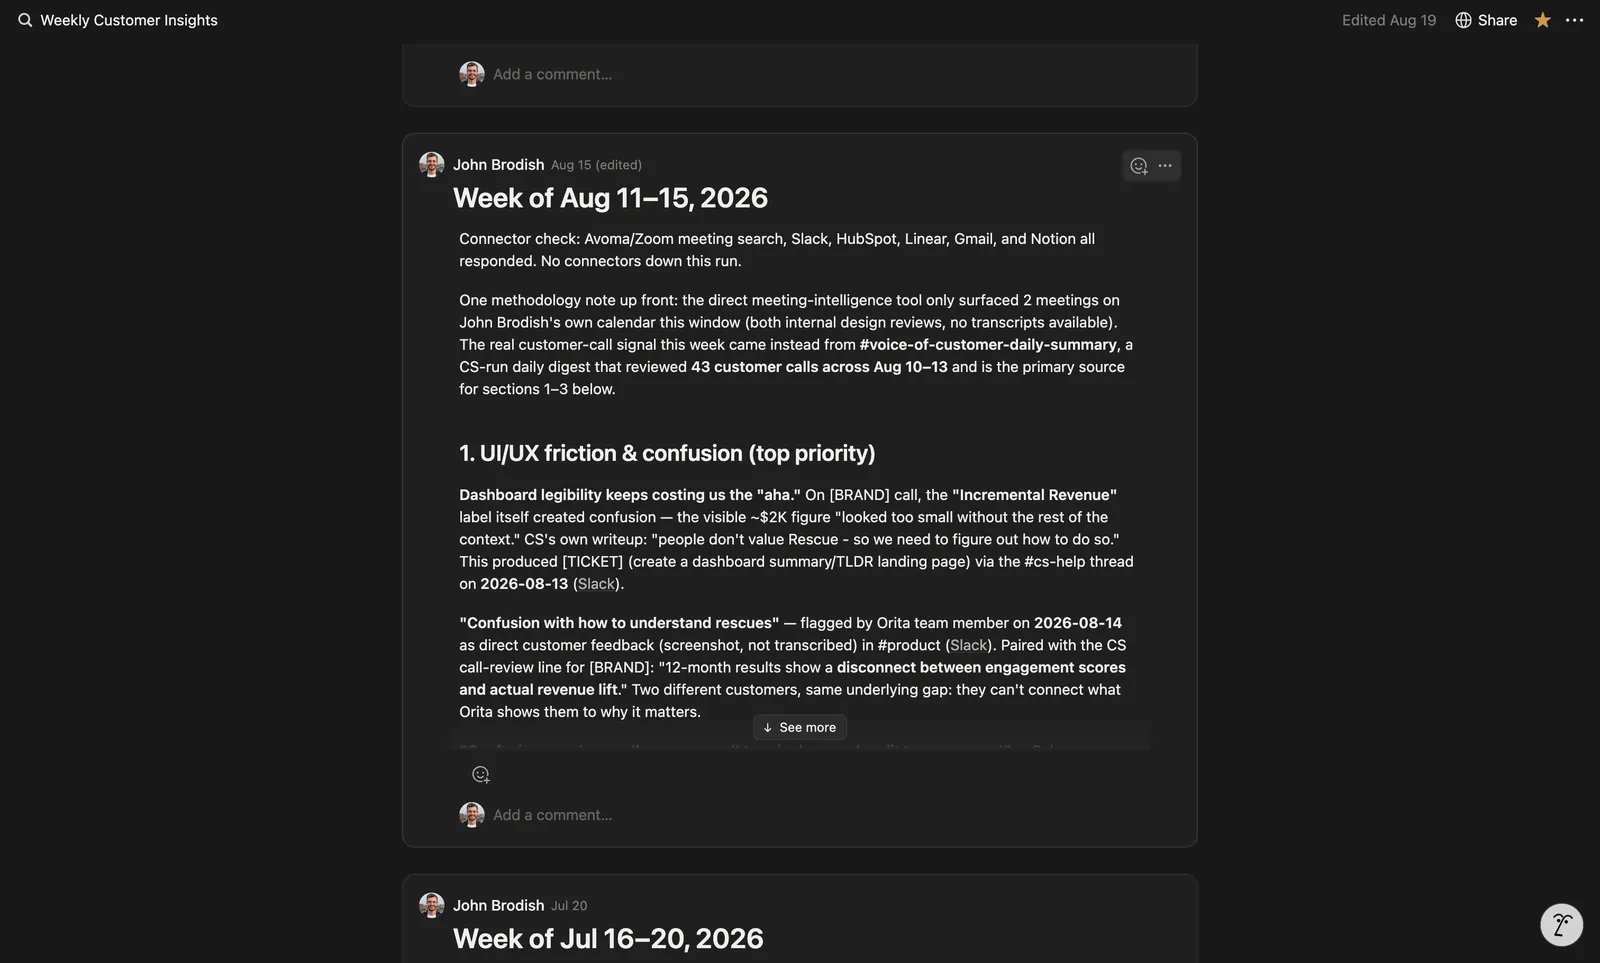
I built and operate an agent pipeline that mines customer calls and notes into design-relevant themes weekly. It’s how the trust problems kept surfacing after my week on the planner ended: a projection that read near-double actuals to a small brand while a recompute was within 10 percent — accurate enough, and still a felt-trust miss. Comparisons that were technically correct, situationally wrong. An empty state indistinguishable from broken. My digests argued for a persistent plain-language explainer layer; the dashboard-summary work that followed is the team’s.
What I claim, and what I don’t
Shipped — the lift-summary redesign·the Campaign Planner’s trust decisions
Mine — the legibility critique and concepts·the research program·the explainer pattern in my mocks·the pipeline and the advocacy
Worked with — the head of product, whose idea the planner was·a project lead on customer discovery·the engineers who implemented·the CS and ops stakeholders who reviewed and approved inline
There was no design team here, and my seat refocused on marketing in late 2024; most of the product work on this page I initiated anyway, and it shipped, by going to whoever had what I needed — customer success, engineering, agency users.
Measurement never got the priority I argued for. I pushed for Hotjar in 2024 and watched real sessions a couple of times a week until a portal release removed it; my request to put analytics back stayed a backlog item; a structured CS capture I designed was proposed as a two-week pilot and never ran. When an engineer finally ran my eight questions against the portal’s event logs in September 2026, four could be answered, two came back null, and two couldn’t be asked of the data at all.
Not all of it needed numbers. A column order that buried the answer, a figure people read as money already banked — those are broken against any convention. Plenty of what I did here was applying the standard thing well; the part I’d defend is telling those problems apart from the ones that needed evidence. The explainer layer came out of the interviews and the card sort, not best practice.
What I’d have instrumented, given the choice: how often CS had to talk someone out of the wrong reading, whether the untapped figure changed what customers did next, time to first action on the dashboard, how often planner users expand the detail layer, and the count of support conversations asking why a number is what it is. My pipeline already surfaces that last one, which would at least give a before and an after. Not open rates on the explainer: opening an explanation and understanding a number are different events.
Reflection
Nobody stands next to a dashboard to say “here’s why the number is right.” The interface has to earn calibrated trust on its own: plain language before math, ranges before false precision, confidence stated plainly with proof one click away. That’s the design problem I’ve worked on since 2019, and I have yet to use an AI product that doesn’t have some version of it.